Bitcoin, a worldwide cryptocurrency invented by an unknown person/group with alias Satoshi Nakamoto. It is the first decentralized digital currency, as the system works without a central repository or single administrator. The coins don’t exist in a tangible form but are made by computers and stored in a digital wallet or on the cloud but there is a finite number of bitcoin that can be supplied i.e. 21 million and there are currently 16 million in circulation.
Why this topic? Bitcoin price soars above $11000 to a new record high value! This is the headline all news channels were telecasting from the past few days. Moreover, the question in everyone's mind is Will it survive or is it just a bubble? The value of bitcoin is tied purely to the concept of supply and demand, as the people are getting more aware about it and buying it, the prices are increasing. As we compare to other established currencies and commodities like USD/EURO dollar or gold prices, Bitcoin has been very volatile and also the market for Bitcoin is not regulated as per the laws. Still bitcoin prices are rising wildly, you might be wondering how wild it can be - Seven years ago, two pizzas could be bought for 10,000 bitcoins, which today would be worth $100 million.
(http://markets.businessinsider.com/currencies/news/bitcoin-pizza-10000-100-million-2017-11-1009827466)
Demand is increasing, alongside criticism, if you want to get involved in the cryptocurrency then awareness is the key. Therefore, we will be doing a thorough analysis about the benefits and risks involved for a potential investor willing to diversify his/her portfolio of investment and then conclude "Would it be the best use of an investor's money?"
Our targeted audience is a potential investor interested in diversifying his/her existing portfolio of investments. In order to maximize expected return and minimize foreseeable risk inherited in the current industries of his/her investments, the ultimate objective of the mentioned investor is to invest in a industry different than the existing ones, and we are analyzing the positive and negative aspects of investing in crytocurrencies, specifically Bitcoin and "Will it a profitable avenue for the audience to consider investing in?" The reason we selected this as our specific audience because their current need of diversification resonates very well with the price appreciation of Bitcoin and the other top crypto-currencies in the market. And also we wanted an audience that is familiar with the market already and understands the risk involved.
The Audience is interested in taking profits from the likely arbitrage opportunity embedded in the cryptocurrencies. As we see in the patterns and trends of cryptocurrencies historical prices, there are short-term spikes and upticks in the prices which pose a decent profit making opportunity for prospective investors. Therefore, the immediate of the audience is to diversify their investment portfolio and to reap the benefits of earning sizable profits from investing in a digital currency like Bitcoin.
An investor looking to invest would want to ascertain the positive aspects of investing in cryptocurrencies. The chances of earning a higher profit margin and return on investment as compared to other traditional investments are also part of the wants of our audience. He/she would also want to see the risks involved while investing. The reason why the Investors have this want is because they want to expand the horizon of their investments and crypto-currencies are one good avenue of investment in the new technology age.
Being virtual and digital currencies, Cryptocurrencies are not backed by any government or a regulatory agency and the operations are decentralized as compared to the traditional centralized banking system and the financial markets. Therefore, a general perception and an expected fear of our audience would be the safety, reliability and foreseeability of their investment in cryptocurrencies. Since the legal status of cryptocurrencies still varies from country to country as some of them have yet not legalized its trading, so another audience fear may be the legality and sustainability of investing in the digital currencies.
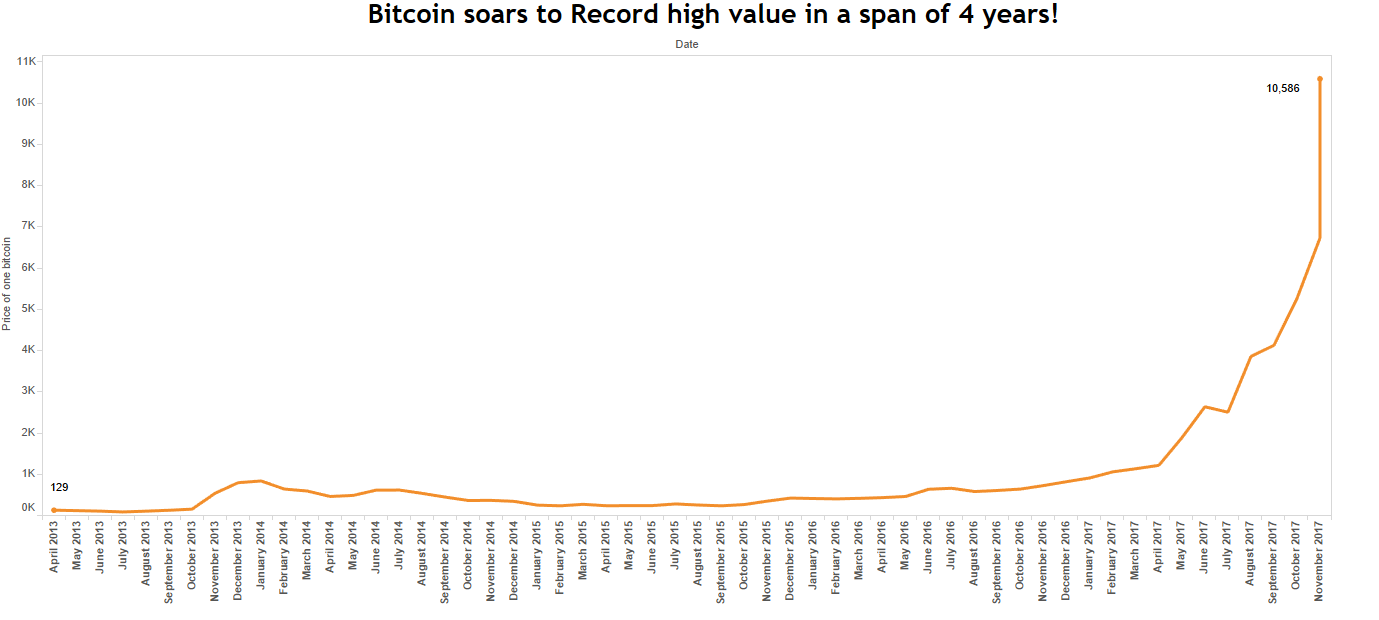
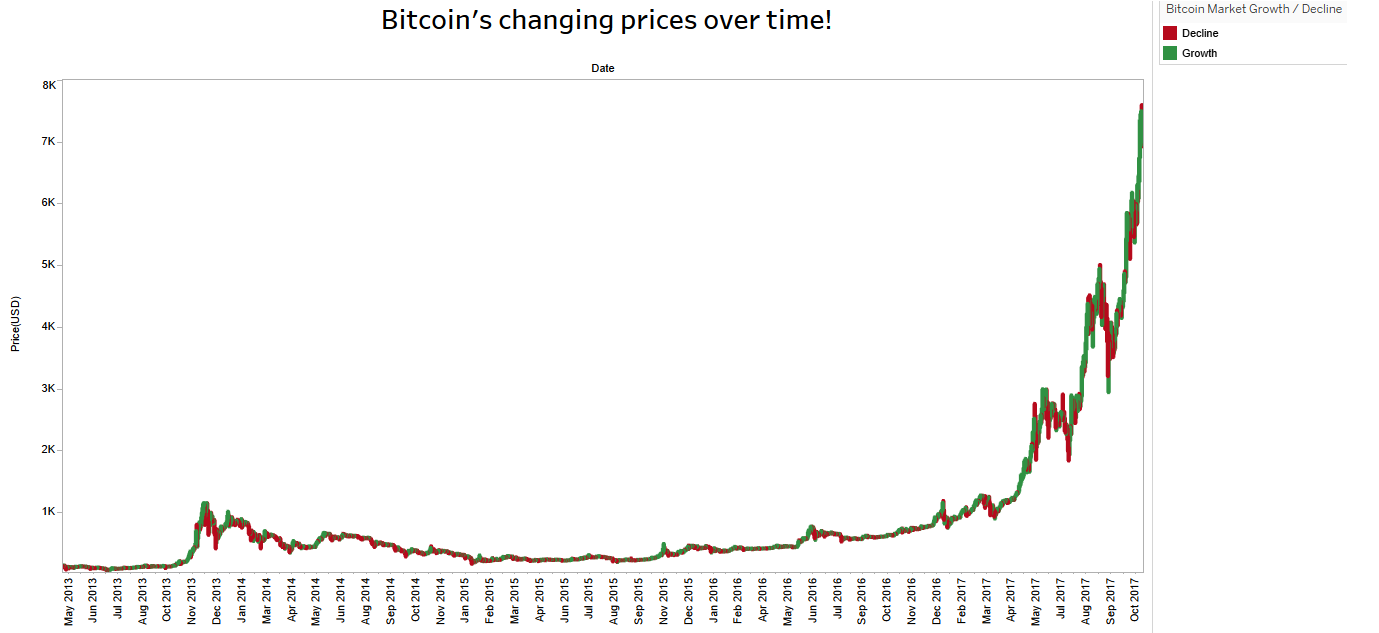
To start with the data analysis, we collected data from 2013 to 2017 about the closing stock prices of Bitcoin and put that into tableau to get an overall picture of trends shown by Bitcoin over the time. The visualization showed, there was an increase in the price of bitcoin in the initial years because people started to get some insight about the cryptocurrency world and started buying and keeping it as an asset but then due to speculations in people’s mind that it is unstable and not legal and can crash anytime, made the prices to go down. After this, 2017 started with a bang as Bitcoin shot through the $1000 mark with no signs of slowing down and it has reached a record breaking mark of above $11000 today. So, to perceive an overall picture we first started gathering whatever data we could and visualized it using Tableau.
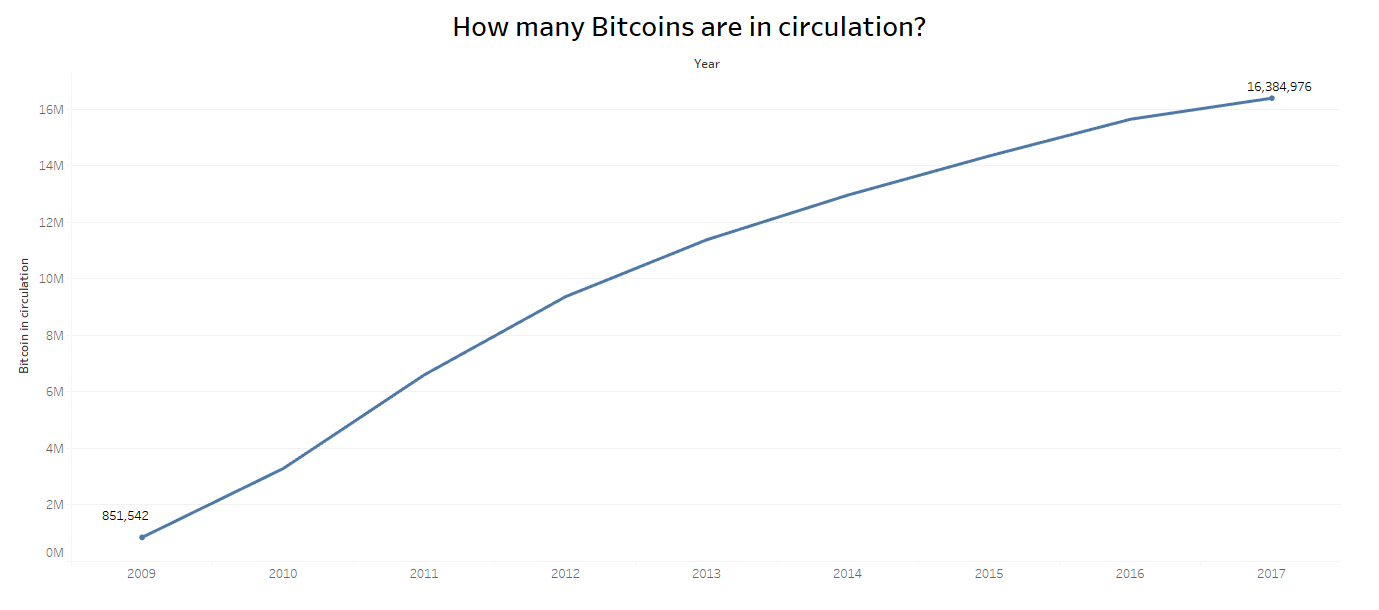
We collected data about the number of bitcoins in circulation. Above graph shows the increasing number of bitcoins over the years in the market. It has been forecasted that only 21m bitcoin can be generated and 16m bitcoins are already in circulation, so bitcoins are finite in number. But this can also imply that as the bitcoins become scarce, the prices are going to rise, the simple demand and supply mechanism. Higher the demand, more are the prices.
(https://support.coinbase.com/customer/portal/articles/1834921-why-does-bitcoin-change-value-why-is-the-price-so-volatile-)
The reason we focussed on Bitcoin out of all the currencies, is because Bitcoin is the first one to be in the market and lot of people still are not aware of it. So, it would be interesting to see the reason behind its soaring prices and whether it is a safe currency to invest, or should you keep it as a long term asset or is it just a bubble that is soon going to crash?
Here is the link to juypter notebook: https://github.com/TeamProject-DataVisualization/Team-project---The-Bitcoin/blob/master/TheBitcoin_JupyterNotebook.ipynb
To reach a decision, we analyzed some key metrics about the market trends shown by the Bitcoin and other currencies. We have multiple data sets web scraped and downloaded from websites like kaggle.com, quandl.com, coindesk.com etc. We collected datasets about open, high, low, close prices of Bitcoin, Ethereum and Litecoin i.e. all the cryptocurrencies, Nasdaq and S&P Index for Bitcoin, Bitcoin’s comparison to USD/EURO currencies. Also, data about number of transactions per day for Bitcoin and Ethereum(the second best crypto-currency in the market) to see if there are some exceptions. As cryptocurrencies are also being used as Initial coin offerings by some companies, we collected data about Bitcoin’s and Ethereum’s Return on Investment since ICO.
Why we selected this data? Because the audience we are presuming are "Investors looking to diversify their investment portfolio". So, while investing somewhere they would certainly like to know how this particular currency is better than the others in the market and also would like to look at the historical price trends of each to make a decision.
We have shown data until 7th Nov, 2017 because thats when we started with the data analysis and wrangling. Also, there are many null values in the datasets because of the time range difference. For example, for Bitcoin we have data from 2013 and Ethereum came in 2015. So when we integrated data we got null for Ethereum values for years 2013-2014. The datasets did not require much cleaning, we renamed some columns and integrated the datasets as per the common attributes and got 3 different datasets in the end. Data sources are mentioned below:
Data comparing EURO, USD Index prices:
http://www.global-view.com/forex-trading-tools/forex-history/, http://www.macrotrends.net/1329/us-dollar-index-historical-chart
Data about Number of Transactions per day for Bitcoin and Ethereum:
https://etherscan.io/chart/tx, https://www.quandl.com/data/BCHAIN/TOTBC-Total-Bitcoins?utm_medium=graph&utm_source=quandl
Data about Open, High, Low, Close prices of cryptocurrencies(Bitcoin, Litecoin, Monero, Ethereum):
https://www.kaggle.com/team-ai/bitcoin-price-prediction/data, https://www.kaggle.com/sudalairajkumar/cryptocurrencypricehistory/data
Data about S&P 500 and Nasdaq Index:
http://www.nasdaq.com/symbol/spy/historical,
https://finance.yahoo.com/quote/%5EIXIC/history?period1=34588800&period2=1511510400&interval
Data about Bitcoin and Ethereum's Return on Investment(ROI) since they are being used as Initial Coin Offerings(ICO):
https://www.icostats.com/vs-btc
Comparing 3 cryptocurrencies(Bitcoin, Ethereum and Litecoin) Candlesticks showing change in prices over time
 Data Source: https://www.kaggle.com/team-ai/bitcoin-price-prediction/data \citep
 Data Source: https://www.kaggle.com/sudalairajkumar/cryptocurrencypricehistory/data
 Data Source: https://www.kaggle.com/sudalairajkumar/cryptocurrencypricehistory/data
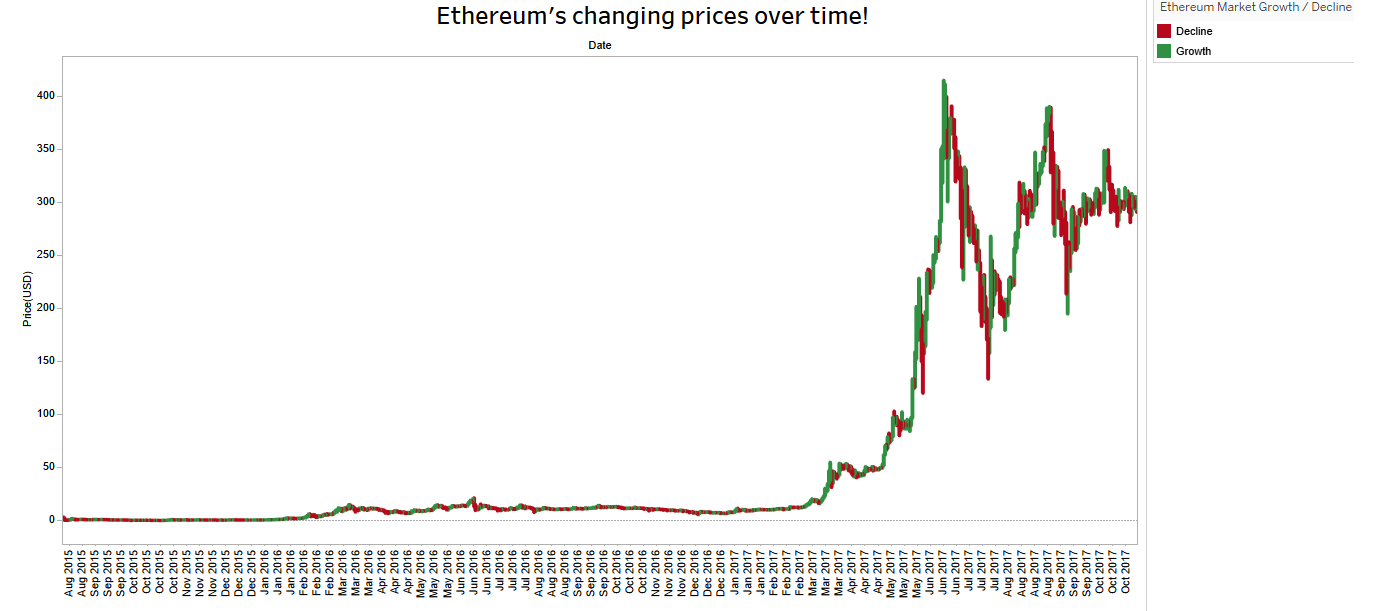
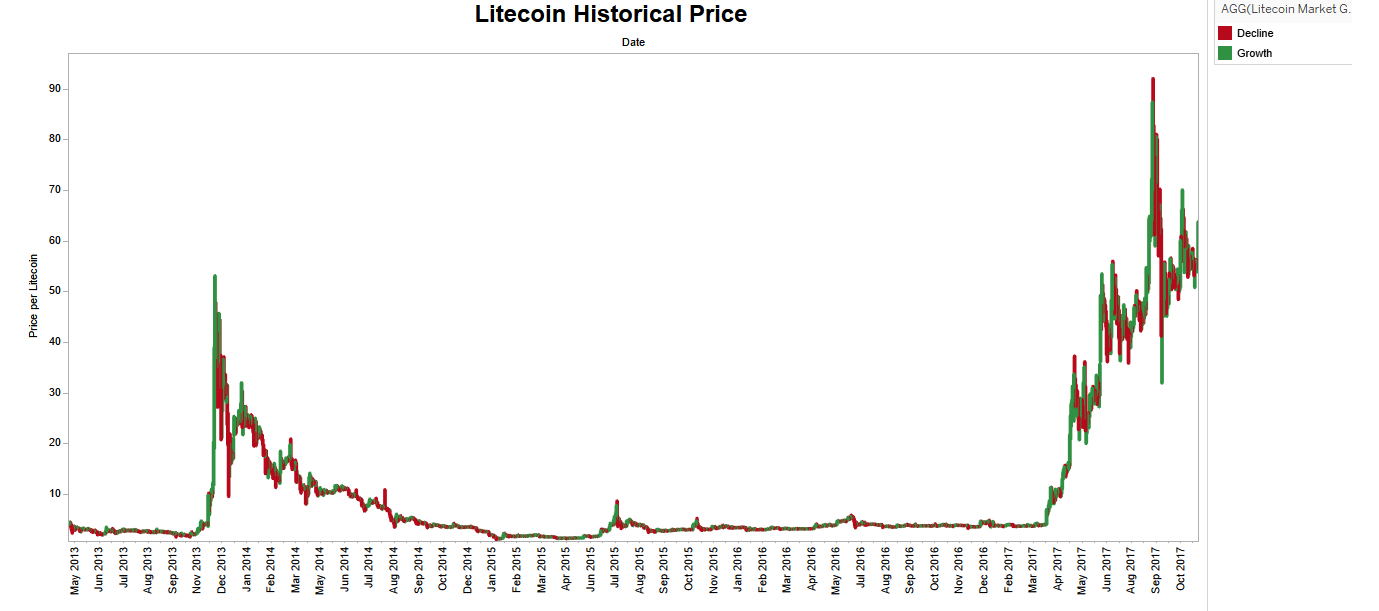
Bitcoin, being the oldest in the cryptocurrency market provides a peer-to-peer transaction for all prospective investors and Ethereum is its biggest competitor. The above three graphs show candlestick charts for Bitcoin, Ethereum and Litecoin showing the historical price pattern, since Ethereum was launched in 2015, we have taken a timeline of 2013-2017 to maximize the Data-Viz ratio, so that we don't use extra pixels when not needed. As we observe, Bitcoin has witnessed a tremendous increase in its market price since inception and has remained the least volatile cryptocurrency in terms of investment and the price appreciation over the recent years.
(http://www.businessinsider.com/bitcoin-price-etherum-and-other-cryptocurrencies-compare-2017-9)
While Ethereum had a wide volatility rate in 2017. Despite being considered and generally perceived to be a digital currency which in technical terms, Bitcoin is, it is however currently operated as an investment with exceptionally great profit margins as mentioned in other metrics where we are comparing it to USD/EURO dollars.
For Litecoin, we can see that Litecoin’s price suffered high fluctuations in 2014 and 2017 primarily due to its digital currency feature. Litecoin’s market capitalization stands at $3.77 Billion and is seventh in terms of ranking among the cryptocurrencies. It is highly volatile when compared to Bitcoin because whenever it experiences an upstick, after that it suffers a high drop, which acts as an aversion.
 Data Source: https://www.kaggle.com/team-ai/bitcoin-price-prediction/data
 Data Source: https://www.kaggle.com/sudalairajkumar/cryptocurrencypricehistory/data
 Data Source: https://www.kaggle.com/sudalairajkumar/cryptocurrencypricehistory/data
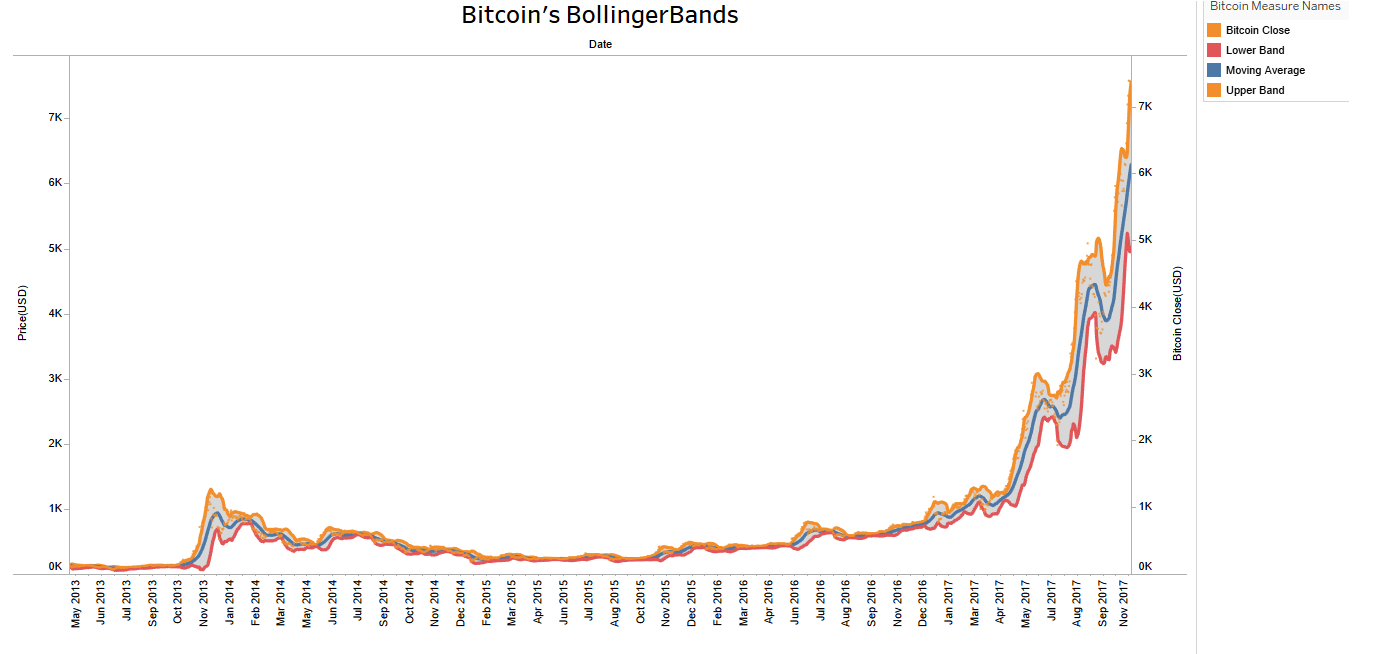
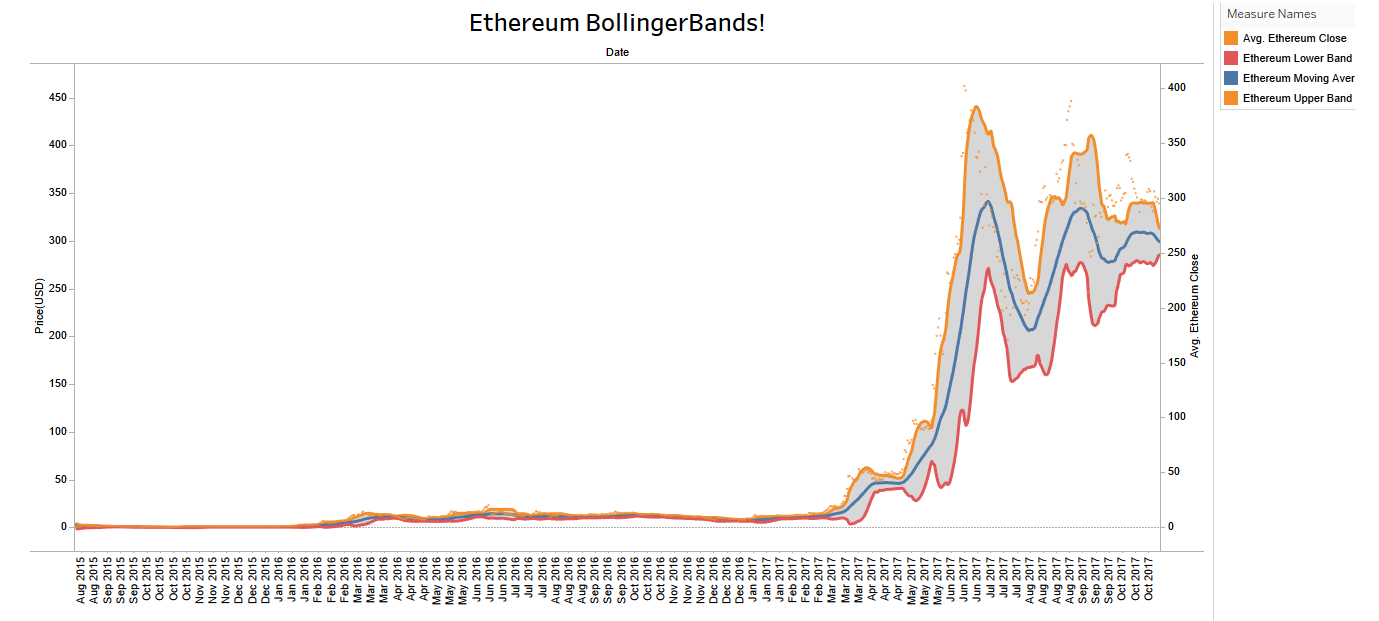
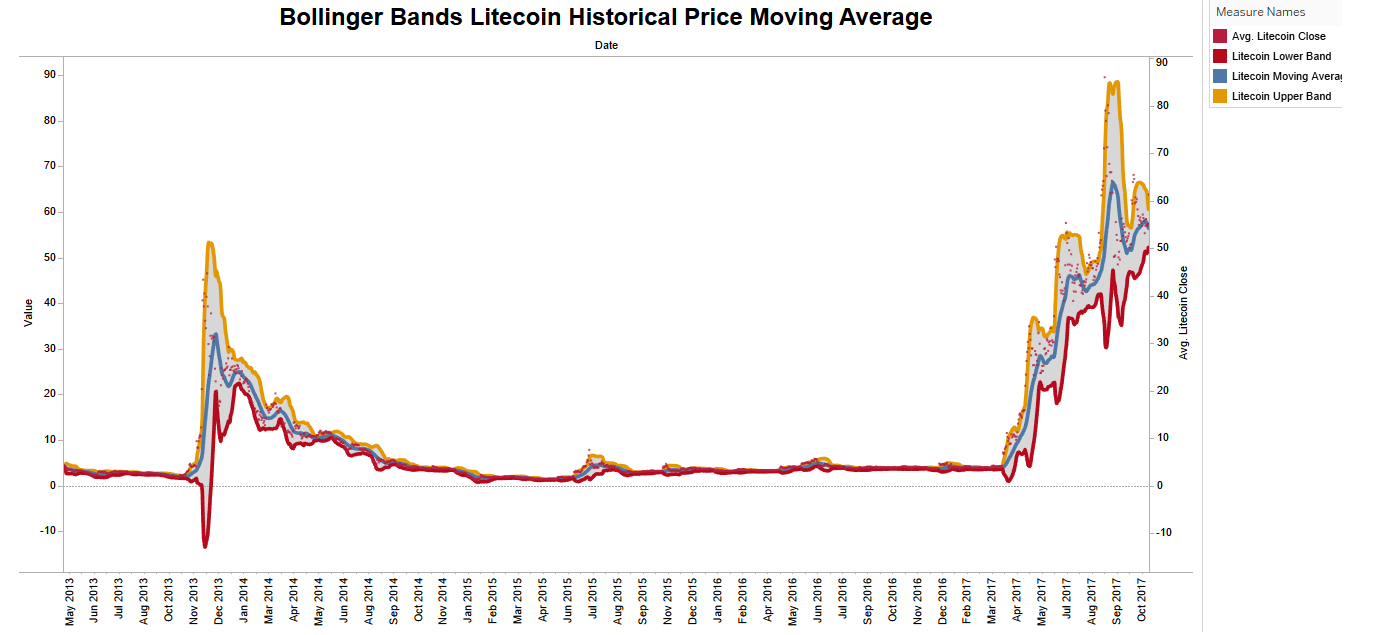
The above Tableau visual shows the Bollinger Bands for Bitcoin, Ethereum and Litecoin's price using moving average and utilizing the lower and upper band as price indicators. As we see, Bitcoin has witnessed a steady rise and its moving average has reasonably stayed with the lower and upper bands. This indicates less volatility and better foreseeability for prospective investors interested in investing in Bitcoin while for Ethereum, since upper and lower bands indicate volatility, we can see that it has suffered a drastic volatility in 2017 as the bands widened in the gap from the moving average in the middle. Though this trend was witnessed by almost all of the major cryptocurrencies in the year 2017 but volatility of Ethereum was higher than that of Bitcoin. Similarly for Litecoin, it has high volatility as compared to bitcoin, as there is more gap in upper and lower bands.
The reason being, Ethereum is an altcoin which makes it more prone to pump and dump behavior and less likely to be considered a long term asset. So, Ethereum being new to market is experiencing high supply and people can move it around faster because of its low fees and block times. Therefore, Bitcoin can be a better investment than the others.
The charts above cannot be compared on similar grounds as they all have different scales because of different average prices over the years and we are just plotting the absolute values. Also, for Ethereum the date axis is bit off, which should not be the case. It would be interesting to summarize the charts into one by taking the percentage difference of average closing prices on one axis, so that we can have standard grounds for comparison and based on that we can show how one is better than the other. This will also strike out the problem of "Eye beats memory", as we can compare them in one chart.
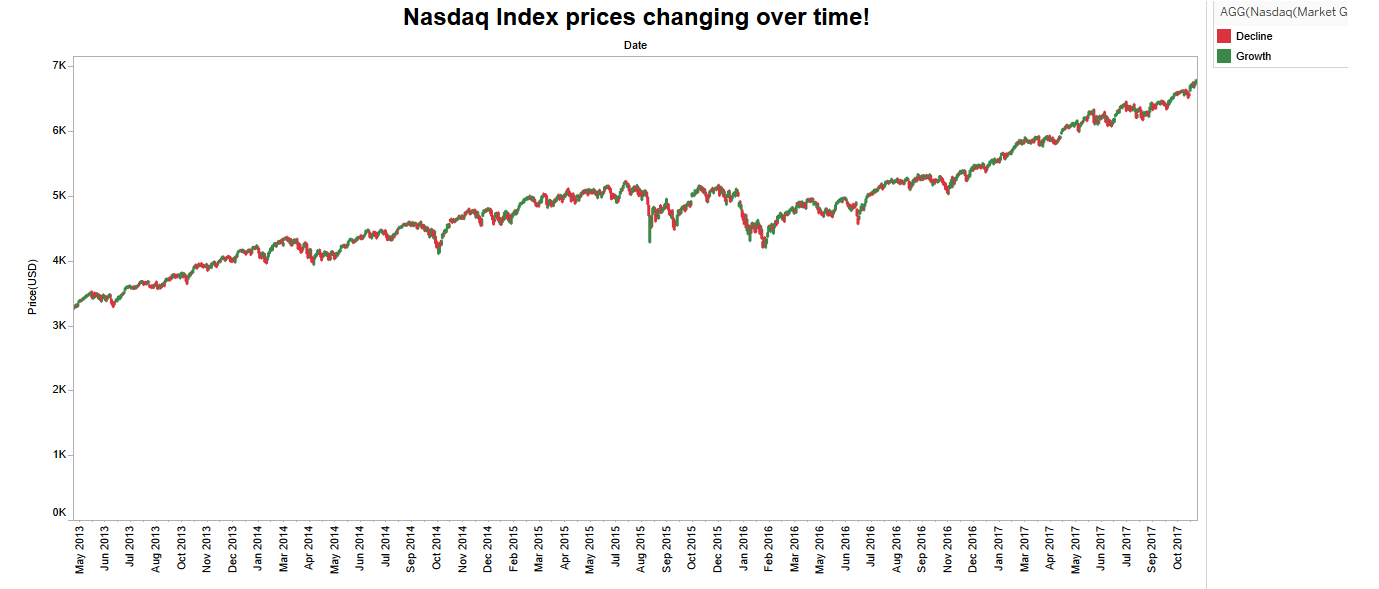
The above charts show the candlesticks for Bitcoin, S&P 500 and Nasdaq Index comparing the average close prices for each. When we compare the three charts, it seems that Nasdaq and S&P 500 are performing almost same but that is not true because the axis scale is different for both. Though, Nasdaq and Bitcoin have similar scales. When we compare all three, Bitcoin is undoubtedly performing better, but this will be a Deceptive visualization because the scales are different. So, instead of plotting the absolute values, we should visualize their performance over time using % differences of their closing prices by using table calculation and see by how much percentage the prices are actually changing.
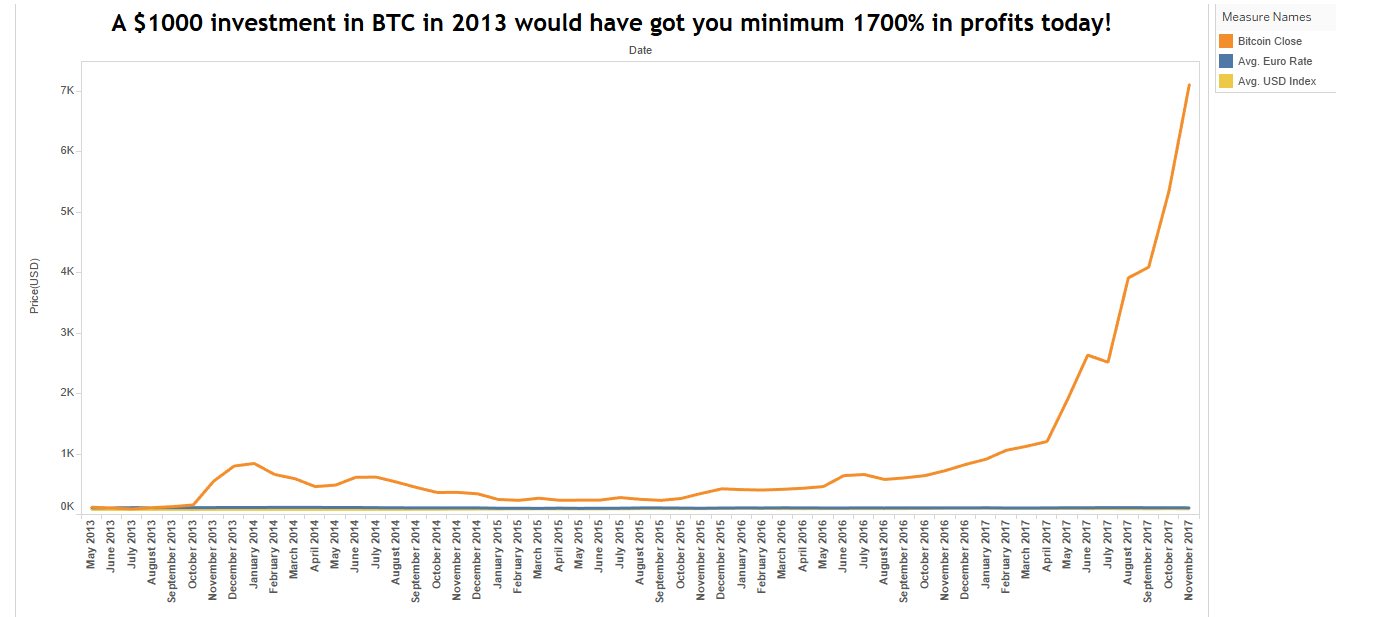
Metrics 1: A $1000 investment in BTC in 2013, would have got you a minimum of 1700% in profits today!
 Data Source: http://www.global-view.com/forex-trading-tools/forex-history/, http://www.macrotrends.net/1329/us-dollar-index-historical-chart
The Visualization above shows a hindsight view of the value of Bitcoin against the major established currencies like USD and Euro in the market. The Cryptocurrency market is different from the standard currency market in a way that the currencies are highly circulated to buy/sell goods and services globally and every platform accept these for transactions. But for Bitcoin, there are not as many platforms as other currencies have for tranactions, people have lately started to accept it. But as we observe the graph, the average prices in the cryptocurrency market are very high. So, for the sake of investment and to get good returns in future, it will be a good choice to invest in this market. And also based on the past market trends of bitcoin, we can say that if you invest in bitcoin even today, it can promise you more profit than these well established currencies. Bitcoin is indeed, a highly-valued asset to have!
 Data Source:https://etherscan.io/chart/tx, https://www.quandl.com/data/BCHAIN/TOTBC-Total-Bitcoins?utm_medium=graph&utm_source=quandl
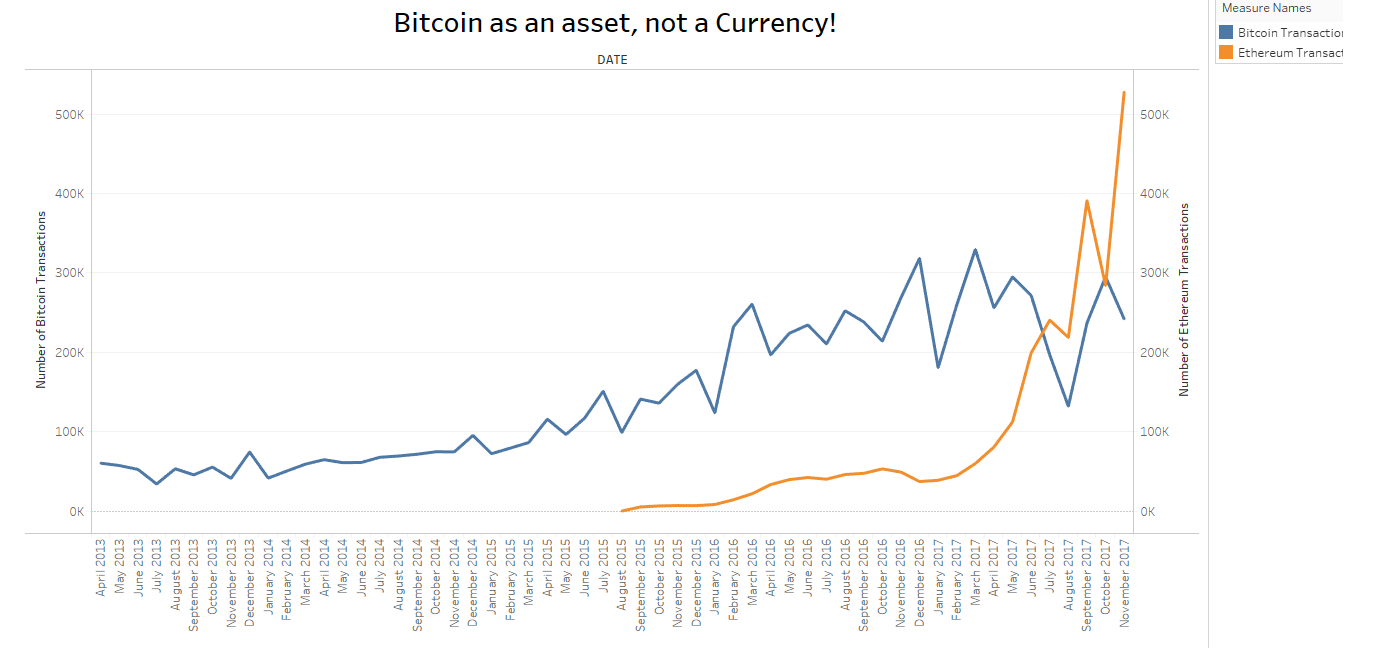
The visualization above shows the number of transactions per day of Bitcoin compared to Ethereum(the second best in the cryptocurrency market). Though Bitcoin came in early (around 2009) the number of transactions per day using bitcoin have not increased very much - just 240K. This number when compared to the time frame which is 8 years is very less, considering the fact that this is a currency. The reason behind this – A Lot of people are buying bitcoins but are not using them in day-to-day transactions as they are treating them as an investment, a long term asset to keep. The comparison with Ethereum makes it clearer. Ethereum has almost doubled in the amount of transactions which means that people are not willing to use it as an asset, but rather using it as a digital currency and a mode of exchange. Therefore, we can conclude Bitcoin is an asset and not a currency as perceived by people!
(https://www.forbes.com/forbes/welcome/?toURL=https://www.forbes.com/sites/jeffreydorfman/2017/05/17/bitcoin-is-an-asset-not-a-currency/&refURL=&referrer=#6a0eeb252e5b)
 Data Source: https://www.kaggle.com/team-ai/bitcoin-price-prediction/data,
https://www.kaggle.com/sudalairajkumar/cryptocurrencypricehistory/data
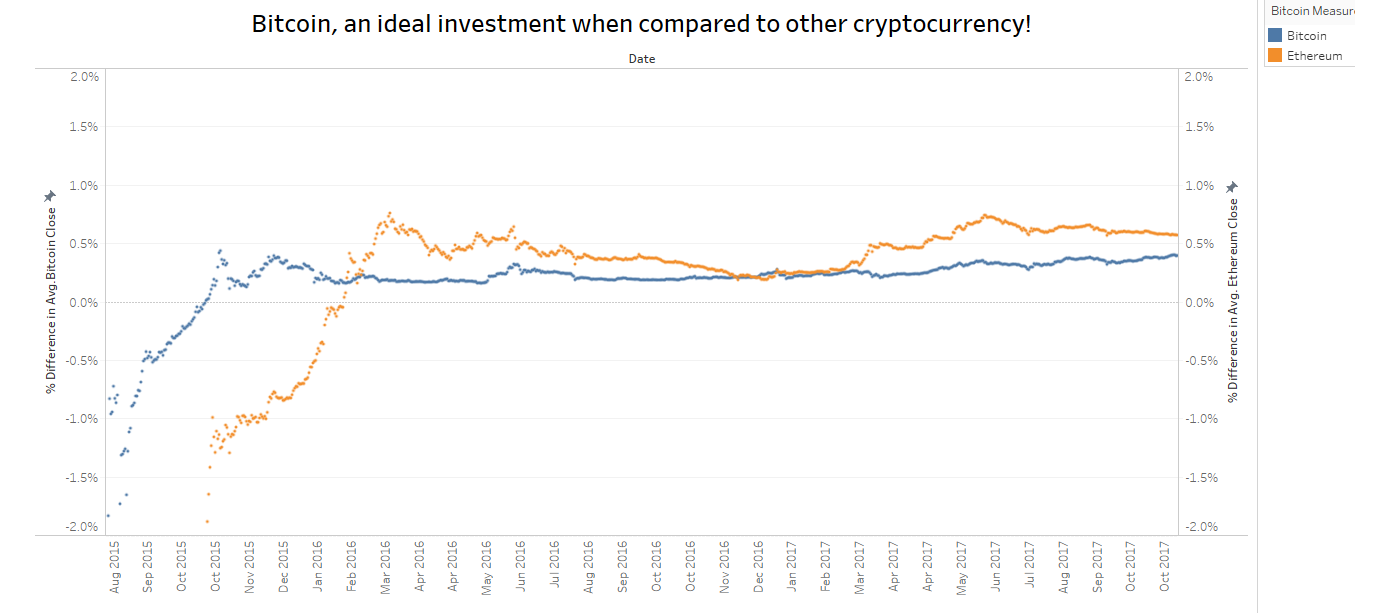
This charts shows the comparison between Bitcoin and Ethereum by using the percentage difference in their average close prices, rather than comparing absolute prices. The percentage difference/change is calculated by new price - old price / old price, which gives the percent increase or decrease of the close price. Hence, higher percentage increase shows high change in price. In the above graph, Ethereum is the one showing high change in prices, which shows its volatility. Though its good to have high increase in profits but there are significant drops as well which makes it unstable and risky.
This is the reason behind considering Bitcoin an ideal investment, it has less fluctuating prices over time and more stable when it comes to an investment perspective. Also, Bitcoin is pretty old as compared to Ethereum so it has a history which can be relied upon. Many financial institutions and banks like J.P. Morgan have announced their plans to introduce cryptocurrency future which would provide attractive investment opportunities to all the prospective investors and would bring even more stability in the market of cryptocurrencies. Bitcoin investment would enable investors to utilize portfolio diversification, hedge their foreseeable risk and maximize the future expected return.
 Data Source: http://www.nasdaq.com/symbol/spy/historical,
https://finance.yahoo.com/quote/%5EIXIC/history?period1=34588800&period2=1511510400&interval
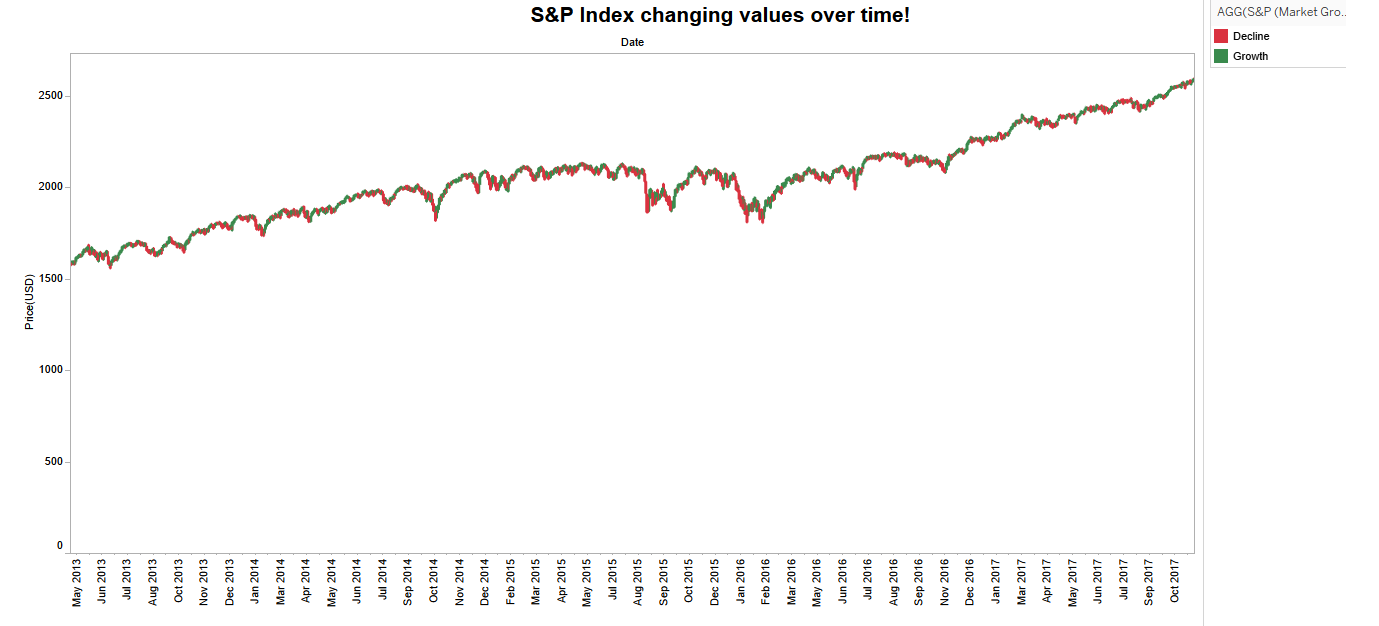
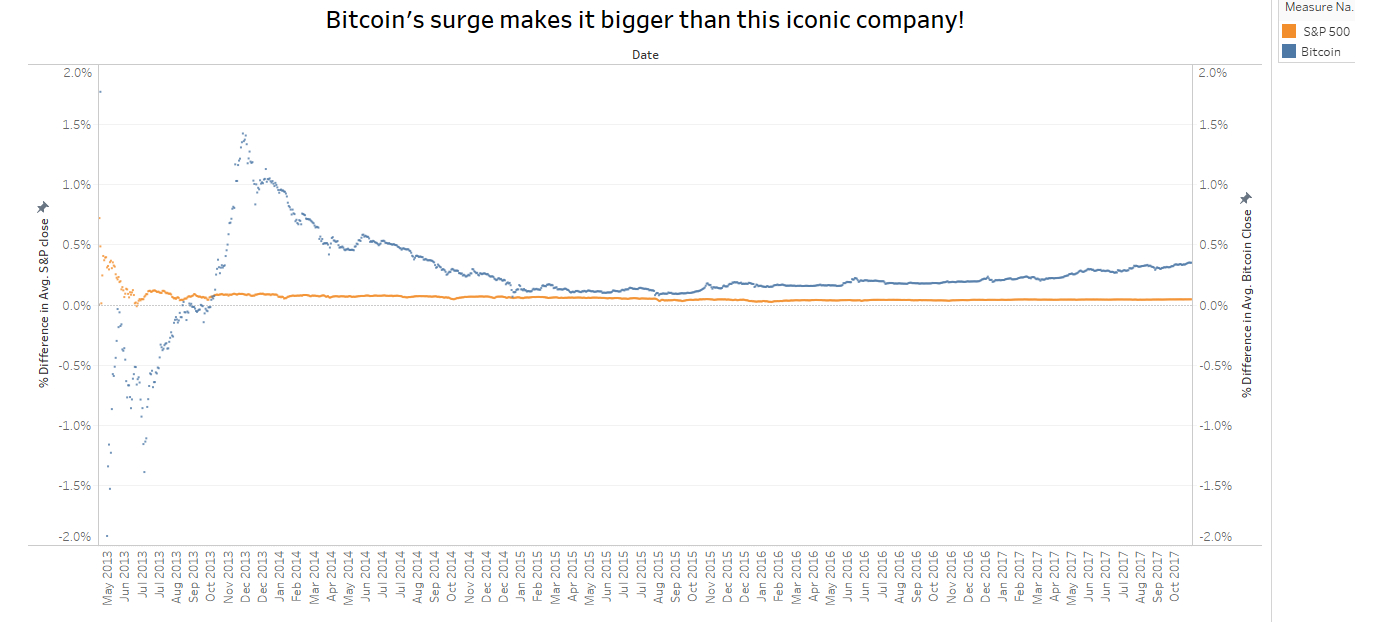
S&P 500 has always been considered a fair place to begin measuring traditional stock market returns. And when we see the percentage difference in closing prices of Bitcoin and S&P 500, we observe that S&P is quite stable with very minimal fluctuation but still low in prices than Bitcoin. Whereas the Bitcoin experienced a drastic high and low in 2013 and 2014 probably because it was new to people and market was less familiar with it, but after that it has been pretty stable and increasing.
By observing the market trends of bitcoin against S&P 500, we all know that Bitcoin has outperformed this iconic company and also has been less volatile over the time. Year over year, its value has risen above 600 percent. Over the last 90 years, the average annual rate of return has only been 9.8% for S&P 500 while Bitcoin's moonshot rise has outperformed this benchmark by 6000 percent.
(https://www.coindesk.com/sp-cryptocurrency-contextualizing-bitcoins-price-explosion/)
Nasdaq itself is planning to introduce bitcoin futures next year, this will further push Bitcoin into the mainstream investing universe. Also, when we look at the graph it compares them on standard grounds on the same scale which gives us the clear idea, why bitcoin is the one you should invest in.
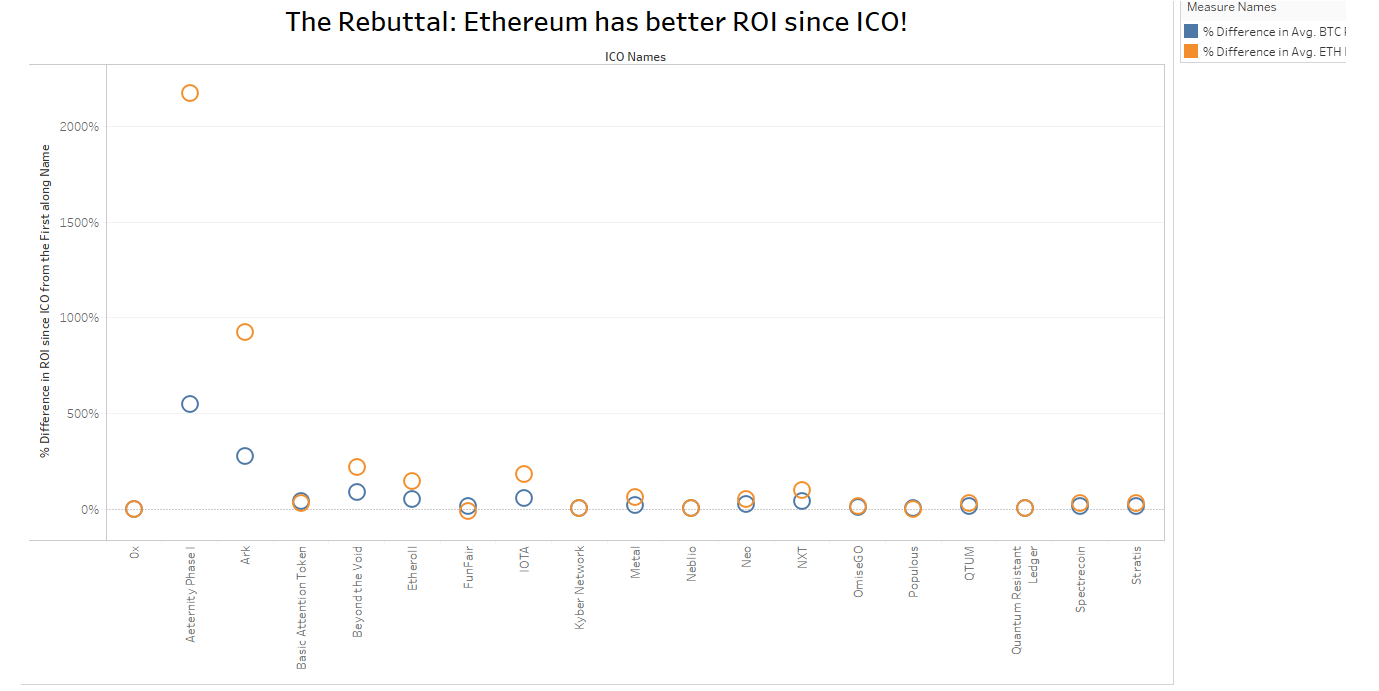 Data Source: https://www.icostats.com/vs-btc
Initial Coin offerings(ICOs) have now grown to be the new source of capital for startups these days, rather than using all the Venture capital. ICOs have raised nearly $2.3billion, with majority of it being raised in 2017. The visualization above shows the Initial coin offering(ICO) names and the ROI for Bitcoin and Ethereum since the time they have started being used as ICO. This shows that Ethereum is better than Bitcoin when it comes to ROI. Ethereum is the block chain-based platform where majority of the ICOs have been developed and hence it is more recognised in terms of ICO.
The reasons behind the growth of cryptocurrencies as ICO is certainly the increasing prices and adoption of block chain technology by the start ups rather than using the traditional innovation strategies.
(https://www.forbes.com/sites/chancebarnett/2017/09/23/inside-the-meteoric-rise-of-icos/#792afb155670)
The investors who invested in early stages have received incredible returns which have made the new investors curious to explore the world of cryptocurrencies. Though Bitcoin is soaring high everyday but when it comes to Return on Investments through ICO, Ethereum is at the first position, it is among the top performers according to icostats.com.
As we observe the graph, we see the percent increase in ROI since ICO for Ethereum is very high than Bitcoin, for specific companies like Aeternity phase I, its 2172% and for other companies also it is high for ETH. Why ICOs choose ETH? ICOs choose ETH because with the ERC20 standard it is both seamless and easy to issue tokens using a smart contract. However, if these ICOs fail, then it does not help ETH, in fact, it harms its reputation and hence price could also drop.
(http://coinnoob.com/ico-choosing)
We wanted to present a sequence of visualizations that can help us to persuade our audience, the Potential Investors to invest in Bitcoin. We wanted to highlight the main features of the worksheet in a narrative way, using story points. Going from benefits to the rebuttal, creates a better impact and help them decide which one weighs more. Also, If we had used a dashboard, it would have been too crowded to display all information on one screen and they could not have paid attention to the details, patterns and trends that are to be observed.
https://drive.google.com/a/scu.edu/file/d/1ZBMnQeAvEFgWtkPZRDKLMBULFo-39OV2/view?usp=sharing
https://drive.google.com/a/scu.edu/file/d/1eIn16tZLVU4Pt2DH7qb3QC5BAXeYIoD6/view?usp=sharing
We can agree, the recent eye-popping gains in the cryptocurrency are hard to ignore, and for investors who want to expand their horizon in the investment market, definitely Bitcoin is the ideal stop. Risk is a part of any kind of investment, be it real estate, gold, oil or other currencies like USD/EURO or iconic companies like S&P 500. The potential of blockchain technology that underlies these virtual currencies is the new age technology. Many startups have started making use of it and also financial markets like Nasdaq have planned to introduce Bitcoin futures starting from next year. When it comes to taxation, the IRS views bitcoin and other virtual currencies as similar to stocks and bonds, and federal tax law dictates that purchasers and/or sellers must treat it as such. As far is limited bitcoin generation capability is concerned, as the Bitcoins will start becoming scarce(and that too in 2140 which is a very long time), the prices will rise as the demands will start increasing. Hence, after analyzing the benefits and risks, we can say that benefits outweigh the risks and Bitcoin, the Internet of money is one wise Investment!
- Since we started early for the data collection, we can add in the latest data about bitcoin and then observe the trends.
- Can analyze the "What if" scenarios for situational awareness.
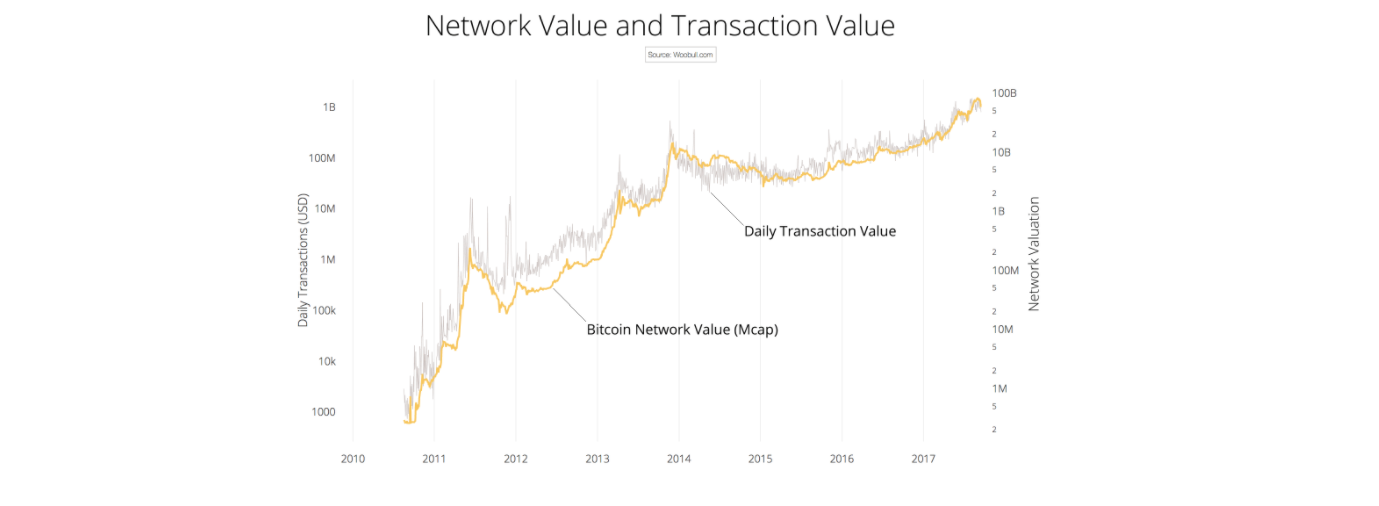
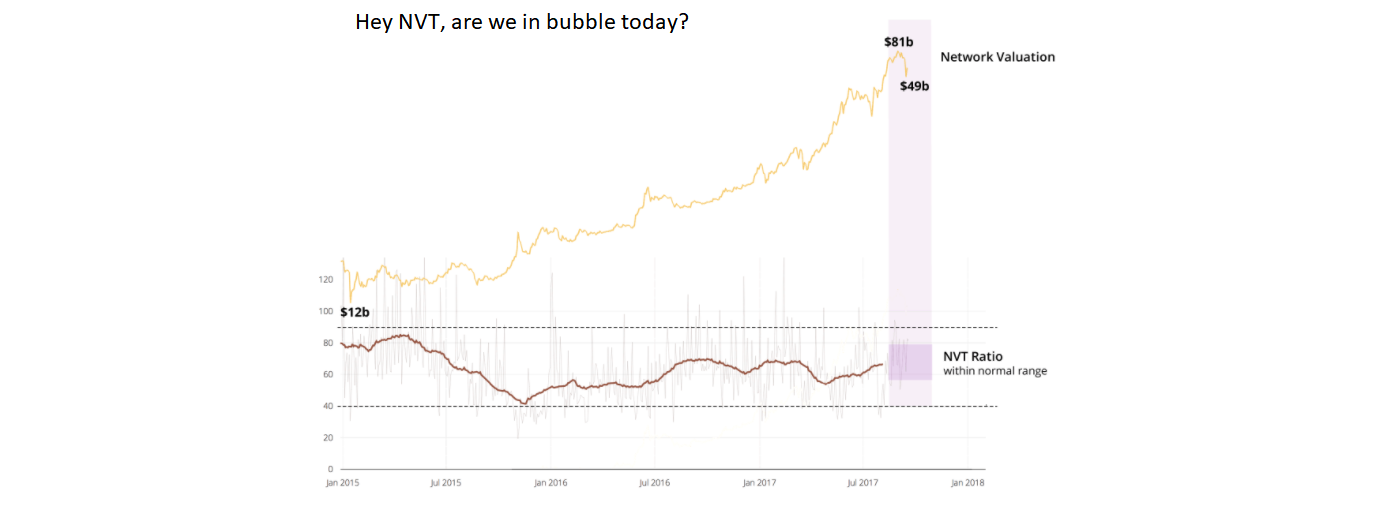
- Can explore the NVT ratio(Bitcoin's PE ratio), which is Network Value to Transactions Ratio. In traditional stock markets, PE ratio has been a long standing tool for valuing companies, where high ratio indicates that company has high growth. NVT is the bitcoin equivalent for PE(Price-earnings)ratio. For bitcoin, we have price per token but for earnings sake, we can consider the money flowing through its market as earnings. We have a chart from the website woobull.com that displays Network Value and Transaction value for Bitcoin and indicates that idea to use money flowing through bitcoin network as network valuation in the ratio is valid.
NVT helps to determine, if a price hike is a bubble or not. So lets see the graph taken from woobull.com showing NVT ratio to test the Bitcoin's market in October 2017, when the network valuation for bitcoin dropped from $81b to $49b. The NVT ratio is within the normal bounds which indicates a price consolidation and not a price crash. Hence, the transaction value flowing through bitcoin's network is healthy and not a bubble.
So, we can further collect more data to calculate and visualize this metrics and identify a bubble, if there is one.
- We could not add proper citations in this read me file, have just put the links. So may be we can explore it and try putting citations for the ease of understanding.
http://markets.businessinsider.com/currencies/news/bitcoin-pizza-10000-100-million-2017-11-1009827466
https://www.coindesk.com/sp-cryptocurrency-contextualizing-bitcoins-price-explosion/
https://support.coinbase.com/customer/portal/articles/1834921-why-does-bitcoin-change-value-why-is-the-price-so-volatile-
https://www.forbes.com/sites/chancebarnett/2017/09/23/inside-the-meteoric-rise-of-icos/#40d1d8985670
http://woobull.com/introducing-nvt-ratio-bitcoins-pe-ratio-use-it-to-detect-bubbles/
https://www.kaggle.com/team-ai/bitcoin-price-prediction/data
https://www.kaggle.com/sudalairajkumar/cryptocurrencypricehistory/data
http://www.businessinsider.com/bitcoin-price-etherum-and-other-cryptocurrencies-compare-2017-9
https://blockgeeks.com/guides/what-is-blockchain-technology/
https://en.wikipedia.org/wiki/Blockchain
https://bravenewcoin.com/news/litecoin-price-analysis-retest-of-all-time-highs-on-the-horizon/
https://www.quandl.com/data/BITCOINWATCH/MINING-Bitcoin-Mining-Statistics
https://www.coinbase.com/what-is-ethereum?locale=en-US
http://www.businesstoday.in/current/economy-politics/bitcoin-dollar-value-crytpocurrencies-rise-invest-10000-buy-investment/story/264817.html
http://www.chicagotribune.com/business/ct-biz-bitcoin-investing-advice-inv-20171114-story.html
https://etherscan.io/chart/tx
https://www.quora.com/Which-one-is-a-better-investment-Bitcoin-Ethereum-Litecoin-or-Ripple
https://coinmarketcap.com/
